

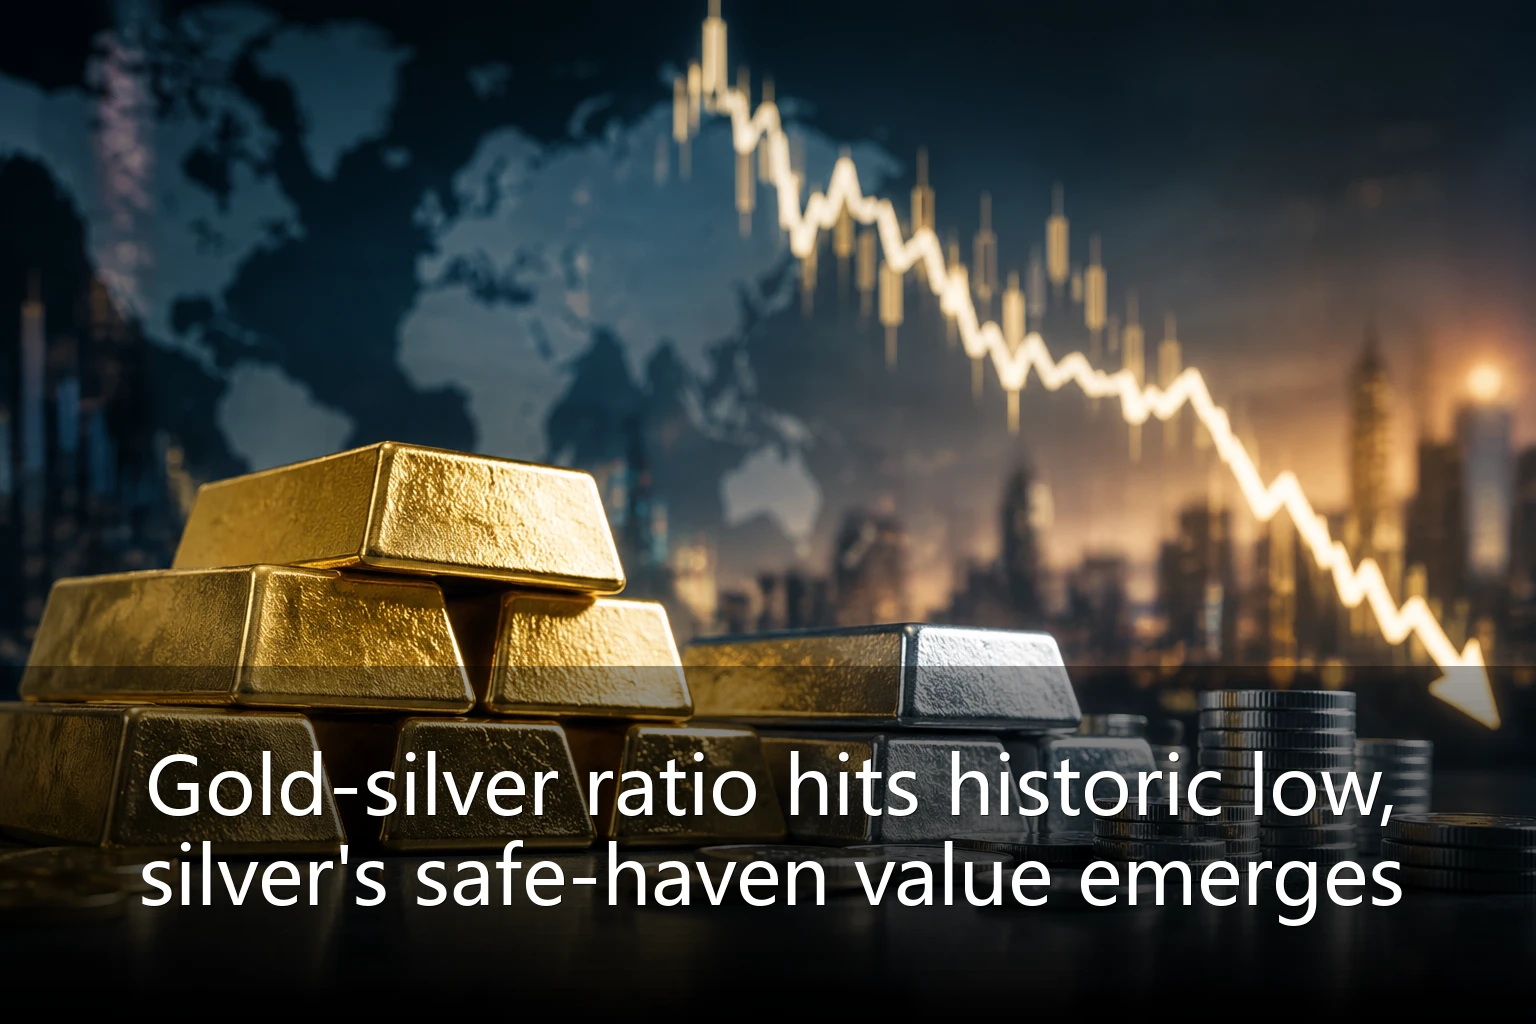
On July 29, 2026, the precious metals market saw a significant shift -- the gold-silver ratio (the ratio of gold to silver prices) plunged to 78.5 during Asian trading hours, the lowest since 2021. The rapid compression of this key indicator has sparked heated discussion among investors about silver's catch-up potential. This article will analyze the underlying logic of the sharp drop from the perspectives of supply-demand dynamics, central bank policies, and capital flows, and explore silver's allocation value.
1. Gold-Silver Ratio: Why the Sudden Drop?
The gold-silver ratio measures how many ounces of silver can be exchanged for one ounce of gold. Its historical average fluctuates between 60-80, and can exceed 100 in extreme scenarios. At the onset of the pandemic in 2020, the ratio surged to over 120, then fell back as the economy recovered. Since July 2026, the ratio has rapidly declined from around 85 to 78.5, primarily driven by the following factors:
- Industrial demand recovery exceeded expectations: The global manufacturing PMI has risen for three consecutive months, with industrial consumption of silver in photovoltaics, 5G, new energy vehicles and other sectors increasing 8% year-on-year. About 50% of silver demand comes from industry, compared to less than 10% for gold, so economic recovery boosts silver more directly.
- Central bank gold buying indirectly boosts silver: According to IMF data, global central banks net purchased 286 tonnes of gold in Q2 2026, a quarterly record. While central bank gold accumulation doesn't directly affect silver, it lifts overall precious metals market sentiment, prompting speculative funds to flow into undervalued silver.
- Supply-side disruptions: Major silver mines in Mexico, Peru and elsewhere saw output drop 4.3% year-on-year in H1 2026 due to labor disputes and environmental reviews. The Silver Institute expects the global supply gap to widen to 5,200 tonnes, the largest in a decade.
2. Macro Environment: Rate Cut Expectations and Dollar Weakness
In the early hours of July 29 Beijing time, the Federal Reserve kept the federal funds rate at 5.25%-5.5% as expected, but removed the phrase "inflation remains elevated" from its policy statement, interpreted by the market as a dovish signal. The CME FedWatch Tool showed the probability of a September rate cut rose to 68%, up 15 percentage points from a week earlier. The dollar index fell below 100, hitting a new low since December 2023. Historical experience suggests that during dollar weakness and rate-cutting cycles, silver tends to be more elastic than gold -- for example, after the 2019 rate-cutting cycle began, silver prices rose 65% within 12 months, far exceeding gold's 35%.
3. Historical Patterns of the Gold-Silver Ratio and Investment Insights
Looking back at data over the past 20 years, a gold-silver ratio above 80 often indicates silver is undervalued, with the ratio likely to revert to the mean. For example, after the ratio exceeded 120 in 2020, silver soared 150% in the following 18 months, bringing the ratio back to 65. Currently at 78.5, the ratio is below 80 but still about 14% above the historical average of 67. If industrial demand continues to improve, the ratio may compress further toward 70, implying significant upside for silver relative to gold.
However, investors should be wary of short-term overbought risks. Silver has risen for six consecutive trading days, with the RSI hitting the 70 overbought line. A technical correction could occur at any time, but in the medium to long term, the supply gap and accommodative monetary environment provide solid support for silver.
4. Outlook: Can Silver Take Over the Safe-Haven Baton?
Gold has been consolidating near $2,450 per ounce recently, while silver broke through $32 per ounce, hitting a high since August 2020. If gold enters a sideways phase, funds may accelerate into silver, driving a catch-up rally. Goldman Sachs' latest report raised its full-year silver price forecast to $35 per ounce, citing the core logic of "gold-silver ratio repair + industrial demand recovery."
For Bangladeshi investors, Dhaka's local silver quotes are closely linked to international markets. The current silver buying price is around 3,240 Bangladeshi Taka per ounce (approximately $28.5/oz, including taxes and premiums). It is recommended to monitor changes in global silver ETF holdings; consecutive net inflows could be a signal to enter. Also, keep a close eye on next week's U.S. non-farm payroll data. If employment cools more than expected, it will further strengthen rate cut expectations, benefiting precious metals.
In summary, the sharp drop in the gold-silver ratio is not just a statistical change, but reflects a reshaping of the internal structure of the precious metals market. Against the triple resonance of central bank gold buying, industrial recovery, and monetary easing, silver's safe-haven and investment value are being repriced. Investors should maintain strategic composure and seek deployment opportunities amid volatility.